Every day, thousands of investors scan analyst price targets hoping for a shortcut to the next winning stock. The problem is that these targets are often worse than useless — they can actively mislead you if you don’t understand what they represent. Learning how to evaluate analyst price targets is a critical skill for anyone managing their own portfolio, because a single number from a single analyst tells you more about that analyst’s incentives than about the stock’s true potential. This post will break down where those numbers come from, how often they miss the mark, and how to use them as one piece of a broader decision framework — without blind faith.
What an Analyst Price Target Actually Represents
An analyst price target is a professional’s estimate of where a stock will trade in the next 12 months. It is not a prediction of fair value in the academic sense, nor is it a guarantee. Analysts publish these targets alongside research reports that justify the number using one of several valuation methods. The most common are discounted cash flow (DCF) analysis, comparable company analysis (comps), and sum-of-the-parts valuation.
In a DCF model, the analyst projects future cash flows and discounts them back to the present using a required rate of return. The output is incredibly sensitive to the assumptions baked in — the growth rate, the discount rate, and the terminal value. Change any one input by a percentage point, and the target can swing by 20% or more.
Comps are simpler: you take a peer group’s multiples (like P/E or EV/EBITDA) and apply them to the company’s expected earnings. But defining the “right” peer group and the “right” multiple leaves enormous room for subjectivity. Sum-of-the-parts is common for conglomerates, but it depends on how you value each segment — and those assumptions can be just as flexible.
The key takeaway: every target is built on a scaffold of assumptions. The number you see is not a fact; it’s the output of a specific model with specific inputs.
The Accuracy Record: Hope vs. Reality
How often do analysts actually hit their targets? Numerous academic and industry studies have tracked this over decades. The consensus finding: the average analyst price target is 20% to 40% off the actual price after 12 months. Even worse, the error is often on the optimistic side — analysts tend to be systemically bullish because their incentives reward positive coverage.
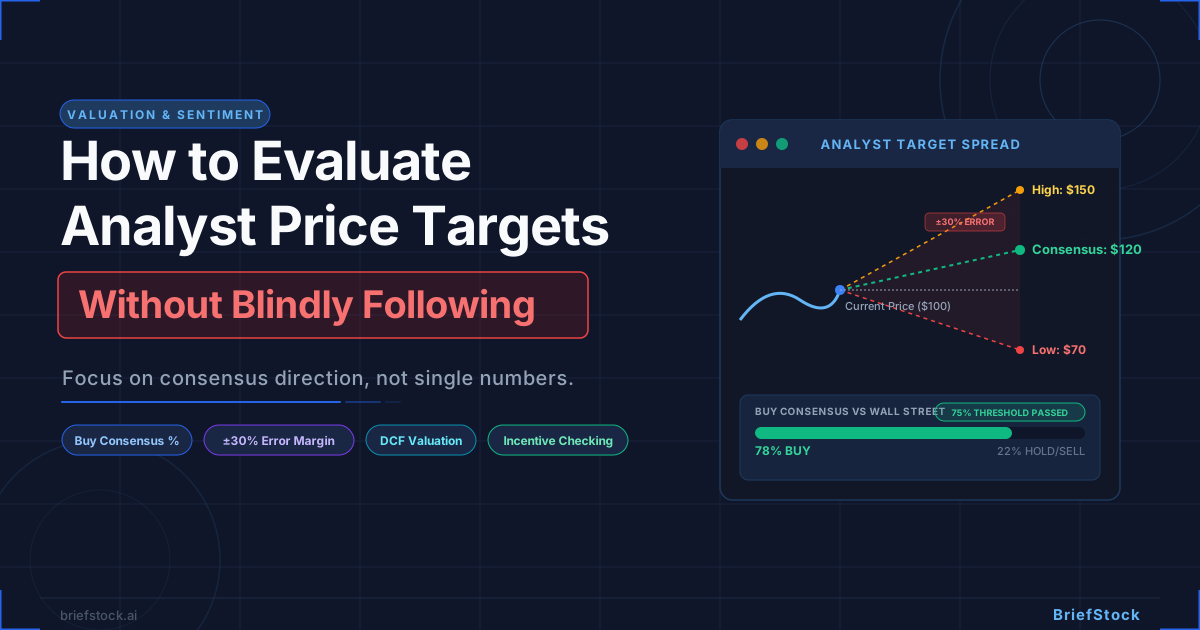
One well-known study by Besanko, et al. found that the mean absolute forecast error for 12-month price targets is roughly 30%. That means if an analyst says a stock will hit $100, there’s a good chance it lands somewhere between $70 and $130. For volatile stocks like TSLA, the error range is even wider. The analyst community has famously disagreed on Tesla for years — some targets have been north of $500 while others have been below $100 simultaneously. That level of disagreement isn’t a flaw; it’s a signal that the stock is highly uncertain and driven by narratives, not fundamentals.
When you see a single analyst target, always ask: where does this sit relative to the consensus? A target that is 50% above the average is likely an outlier driven by a very bullish (or very optimistic) model.
The Conflict of Interest Problem
Analyst targets are not independent opinions. They come from professionals employed by investment banks or brokerage firms that have complex relationships with the companies they cover. The most obvious conflict: investment banking. A bank that wants to win M&A advisory or underwriting business from a company is unlikely to let its research arm publish a “CAUTIOUS” or “SELL” rating. This is not hypothetical — it was the core issue behind the dot-com bust and led to the Global Research Analyst Settlement in 2003.
Even without banking ties, analysts have “access incentives.” A negative report can result in a company cutting off the analyst’s access to management calls, investor days, and non-public data. To maintain their information flow, analysts often temper their criticism. The result is a persistent upward bias in ratings and targets.
You can partially mitigate this by looking at the analyst’s independence. Some boutiques and independent research firms do not have banking arms and are less conflicted. But even they face pressure to produce work that attracts subscribers. The safest approach is to treat any single target as a data point with a known error bar, not as a verdict.
How to Evaluate Analyst Price Targets: Focus on Consensus, Not the Number
Here’s the practical framework: ignore the exact price target. Instead, look at the consensus direction — specifically the percentage of analysts with a “Buy” rating versus “Hold” or “Sell.” This is called the buy-side consensus, and it captures the collective conviction of the analyst community in a way that a single target cannot.
A stock with 90% Buy ratings and a consensus target 30% above the current price is sending a different signal than a stock with 60% Buys and a modest upside target. The first suggests broad institutional support; the second indicates meaningful skepticism.
BriefStock uses a 75%+ buy consensus as a threshold to flag a stock as having strong bullish analyst backing. This is not a buy signal — it’s a filter. If 75% or more analysts recommend buying, the stock passes one check mark in your research process. Pair it with others: valuation, financial health, momentum. For example, NVDA currently has a P/E of 32.82 and a PEG ratio of 0.16 (well under 1.0, suggesting it’s undervalued relative to growth). Its revenue growth is 85.2% year over year, gross margin is a stunning 74.9%, and debt-to-equity is a mere 0.07. The Health Score is 9/10. With that combination, even if a few analysts are cautious, the weight of evidence supports a bullish thesis.
The BriefStock Threshold: 75%+ Buy Consensus
Let me clarify what the 75% threshold is and isn’t. It is a signal that the consensus of professional opinion is strongly positive. It is not a guarantee of future returns, nor does it mean you should blindly buy. Many stocks with 90% Buy ratings have subsequently fallen — the 2021-2022 correction in growth stocks is a perfect example.
What the threshold does is save you time. When you see a stock with less than 75% Buy consensus, it may still be a good investment, but you need to dig deeper. The disagreements among analysts point to unresolved uncertainty. Conversely, a strong consensus simplifies your due diligence: you can accept the bullish thesis as a starting point and then verify the key assumptions yourself.
For stocks where the data is more opaque — like TSLA, which lacks meaningful P/E, PEG, or FCF yield figures — the consensus itself becomes more important. Analyst disagreement on Tesla is legendary; the standard deviation of price targets is often higher than the target itself. In such cases, a low buy-consensus percentage (say, 50-60%) tells you the stock is highly contested, and you should adjust your position sizing accordingly.
Putting It All Together: A Practical Evaluation Flow
Here is a simple checklist you can use next time you’re evaluating a stock’s analyst coverage:
- Check the buy consensus percentage. Is it above 75%? If yes, the broad analyst community is bullish. If not, note the dissenting arguments.
- Compare the consensus target to the current price. A large upside suggests the recent price reflects less than the average expected value.
- Identify any outlier targets. If one analyst is wildly different from the pack, read their report. They may have a unique (or flawed) insight.
- Cross-reference with fundamentals. Use tools like BriefStock to see P/E, PEG, revenue growth, margins, debt, and health score. Verify that the consensus is supported by the numbers.
- Consider the analyst’s firm. Is it an independent research provider or a bulge-bracket bank? Adjust your confidence accordingly.
Using this flow, you transform a single ambiguous number into a structured signal. You’re still doing your own due diligence — but now you’re using the analyst community as a starting point rather than a final answer.
Why the Specific Number Matters Less Than You Think
The 20–40% error range means that even the most sophisticated analysts are often off by double digits. Why? Because the market is a chaotic system driven by news, sentiment, and macro forces that no model can perfectly capture. A DCF model can’t predict a regulatory change, a pandemic, or a supply chain shock.
That’s why how to evaluate analyst price targets is less about the target itself and more about the process behind it. If you understand the model, the assumptions, and the biases, you can extract useful information. If you only see the number, you’re likely to over-weight it.
A practical rule: never let a single price target alone determine your decision. Use it to calibrate your own estimate, not replace it. And always check the direction of the consensus — that’s where the real signal lives.
Conclusion
Learning how to evaluate analyst price targets is a cornerstone of independent investing. The key is to deprioritize the specific number and instead focus on the consensus direction, the level of conviction among analysts (buy percentage), and the underlying fundamentals that justify the estimates. Remember the 20–40% error range, the conflicts of interest, and the fact that a single target is a model output, not a prophecy. Tools like BriefStock help you surface that consensus data quickly — flagging stocks with 75% or higher buy ratings as starting points — without pretending to have the final answer. Use this approach, and you’ll stop following price targets blindly and start using them intelligently.
Not financial advice. BriefStock is a research tool — always do your own due diligence.